The Data Quality Question a Federal Survey Left Unanswered
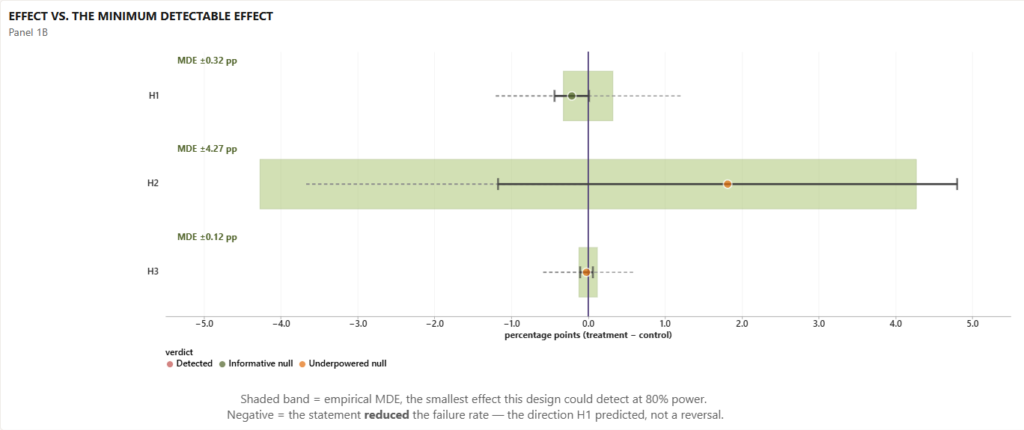
A real randomized experiment inside a federal health survey, testing whether a commitment statement improved data quality. The analysis plan was locked and publicly timestamped before any result was seen, and along the way the build caught four independent bugs, all of which would have made a null result look like a finding.
Diagnosing a Segment Failure Hidden by Healthy Aggregates
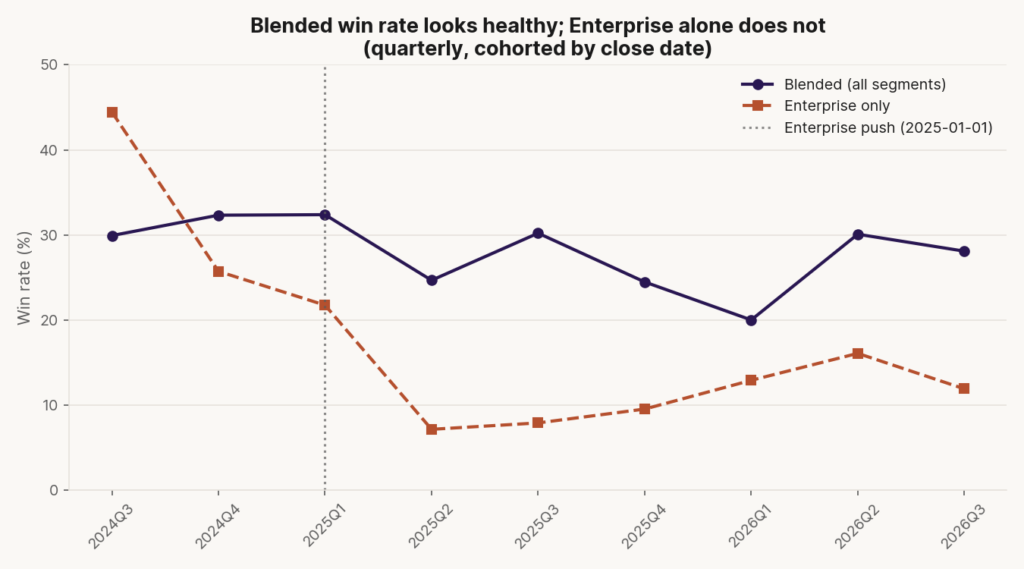
A synthetic, mechanism-generated B2B sales dataset, 900 companies and 2,600 opportunities across 26 months, where no win rate is an input and every outcome is measured. Disaggregation by segment and open-date cohort surfaces the 25-point Enterprise collapse the blended 20-32% band hid, then competing explanations are tested and the result is tied to an 18-month payback.
Rural Hospital Risk Hidden by a Healthy Regional Average
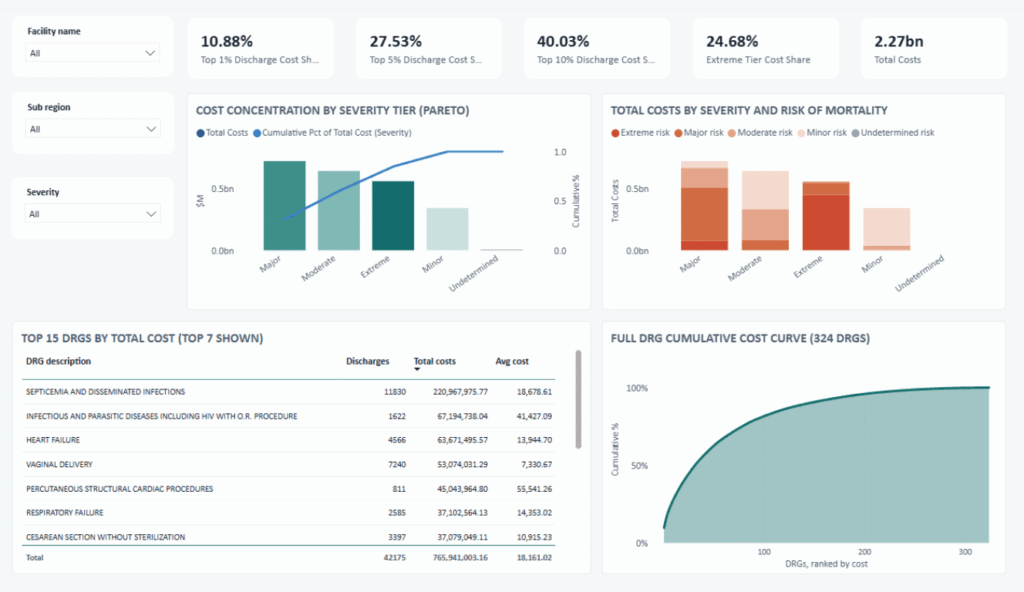
Power BI dashboard built on 143,613 real 2024 hospital discharge records for one New York region, read the way a health insurer’s medical-economics team would read it, not a hospital’s own finance view.