The problem
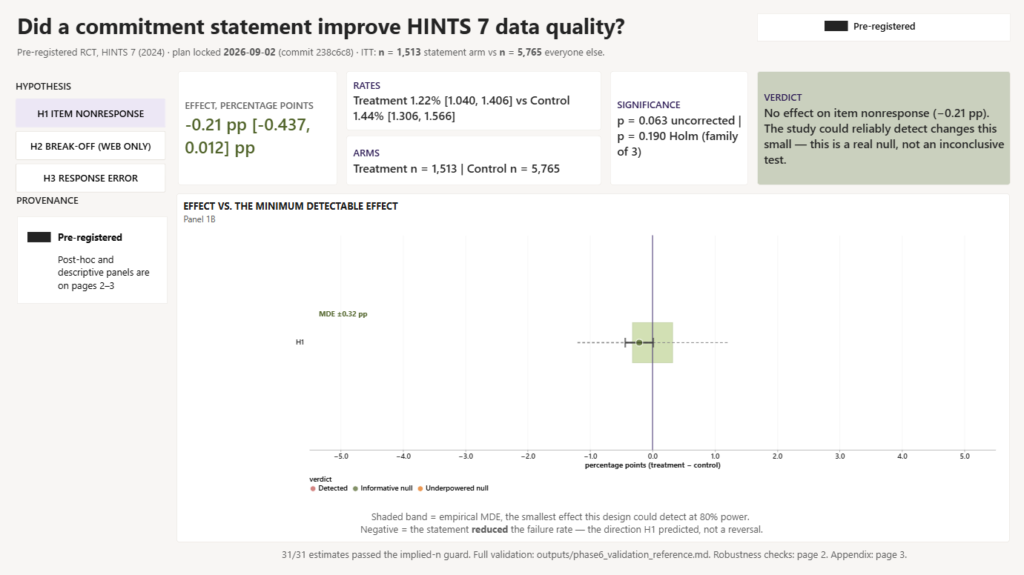
NCI’s own report says what the statement was for: to reduce skipped questions and abandoned surveys, to make the people who did answer, answer more carefully. Then the report published one number: whether more households responded. It didn’t move.
That’s a different question from the one the experiment was built to answer. The real one, did people answer more carefully, never got asked. Both pieces needed to answer it, who got the statement and which questions people skipped, are sitting in the same public file NCI already released.
The approach
Write the whole plan down first: which outcomes count, how they’re measured, what statistical tests apply, before opening the data. Publish it with a timestamp. Then run it, blind to who got the statement until the very last step.
What I found
The first run of the analysis said the statement worked, clearly. It didn’t.
The code had made the same mistake as measuring someone’s height once for every item of clothing they’re wearing: same person, same height, but the math believed it had many independent measurements instead of one. The “confidence” was fake, about twenty times too tight. Once fixed, the effect shrank to a fraction of a percentage point and stopped being distinguishable from nothing.
That wasn’t the only bug:
- A separate error in the weighting math made every error bar seven times too narrow.
- A draft dashboard would have painted two “we found nothing” results the same color as a real effect, because it searched a sentence for the word “detected,” and that word appeared in both.
- Four bugs total, four different files. Every one made a null result look like a finding. Not one made a finding look smaller than it was.
Separately: NCI’s own report says 2,400 people got the statement. The file says 1,513. Checking a second, independent variable (who was actually asked the follow-up question) confirmed the file is right. That’s a federal report with numbers that don’t match its own data.
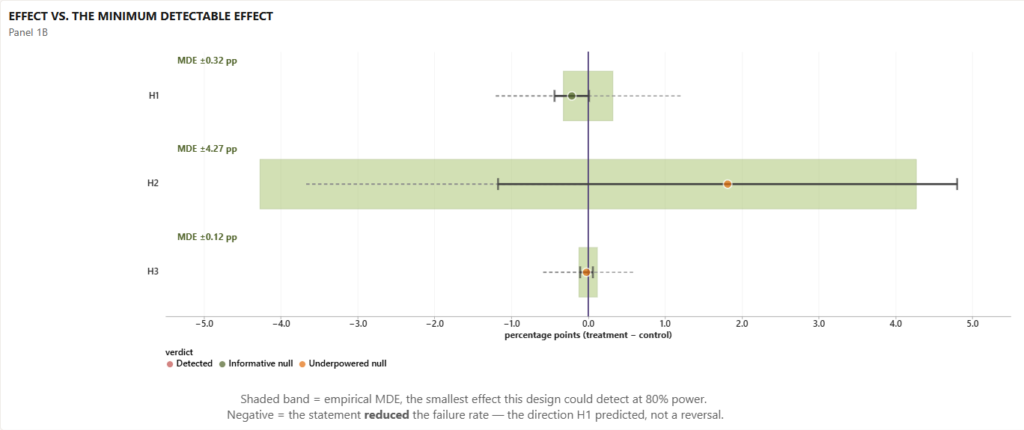
The result: the statement did not measurably improve data quality. The gap between the two groups was 0.21 percentage points, small enough that the experiment (which could reliably catch something as small as 0.3 points) rules out an effect worth caring about, rather than just missing one.
One decision worth naming
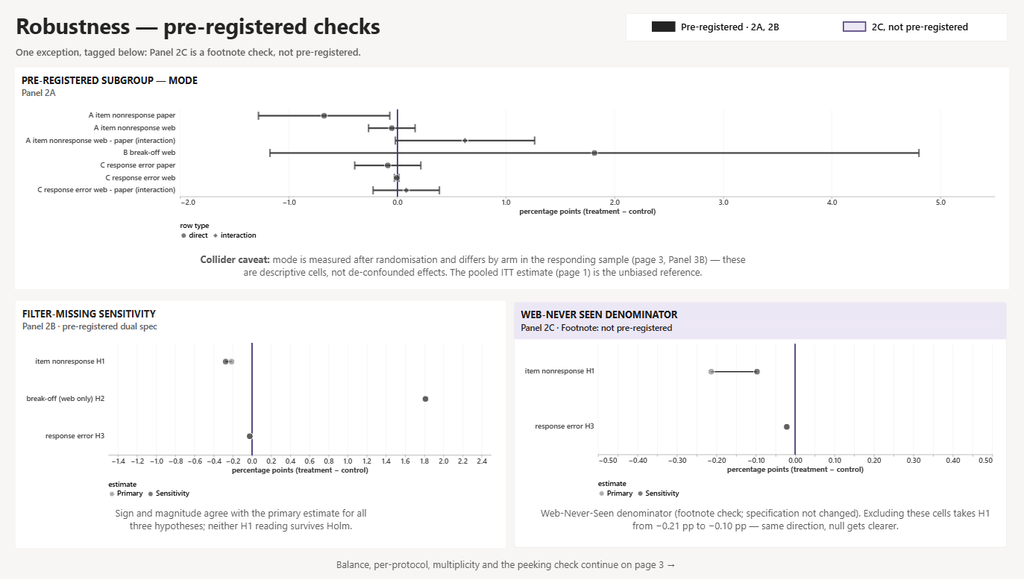
Partway through, a question came up about which cells should count in the denominator. One reading of the plan would have made the null result read even more clearly null. The rule was: don’t change the definition after seeing the answer, even toward a result that would look better. Keep what was built, report the alternative as a footnote.
What this demonstrates
Analyzing a real randomized experiment end to end: comparing the two groups the way the experiment actually intended, accounting for the survey’s real sampling design, pairing every “nothing happened” result with how small an effect the experiment could even catch, and correcting for running three tests instead of one.
The bigger lesson sits underneath the statistics. Mistakes in an analysis don’t happen evenly in both directions. They lean toward whatever looks exciting, because a boring result gets double-checked and an exciting one gets believed. The fix isn’t trying harder to be careful. It’s locking the plan before you know the answer, building checks that fail loudly on a number that looks too good, and never letting a computer infer meaning from a sentence when a label would do.
Full analysis in the GitHub case study.