The problem
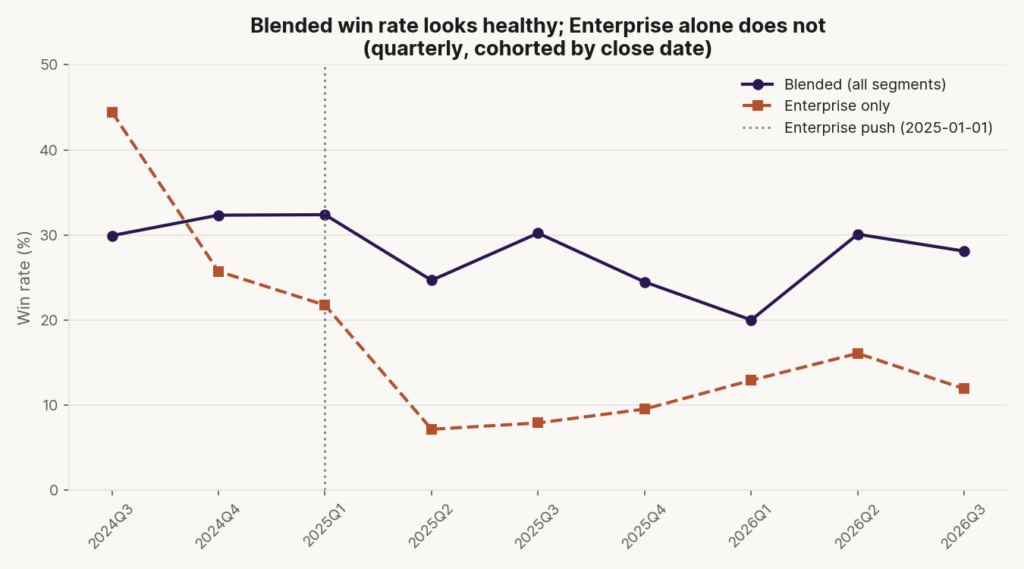
Sales dashboards show one number: blended win rate. That works fine until it doesn’t. A company can report healthy metrics for nine quarters while one segment implodes 25 points and stays structurally invisible.
This happens because aggregates hide. Four segments with three stable and one in crisis average out to “looking fine.” The first principle: aggregates lie. The second: by the time close-date cohorts show a problem, it formed three months earlier in the pipeline. Teams read yesterday’s news. The real question is which segment moved the number, and how far back.
The approach
The core move is disaggregation. Split the blended win rate by segment to find where it is actually moving, then split it again by cohort, open date against close date, to separate when a deal formed from when it closed.
Measure five locked questions: blended unit economics, segment divergence, open-date vs. close-date timing differences, where deals break, and whether rep capability or market conditions drive the decline.
Compute CAC, LTV, payback period, stage duration, and loss reasons by segment and time period. Test competing explanations: competitor pressure, price, channel mix, economic timing.
Key findings
Enterprise win rate collapsed 25 points (35.2% → 10.2%, 95% CI [15.4, 34.8]pp). Blended rate stayed 20-32% the entire window, masking the decline. Aggregates hid the truth.
One-quarter reporting lag. By close date, the problem shows in Q2. By open date, it shows in Q1. Mean deal cycle: 5.9 months. Teams read yesterday’s news. Measurement timing changes what you see.
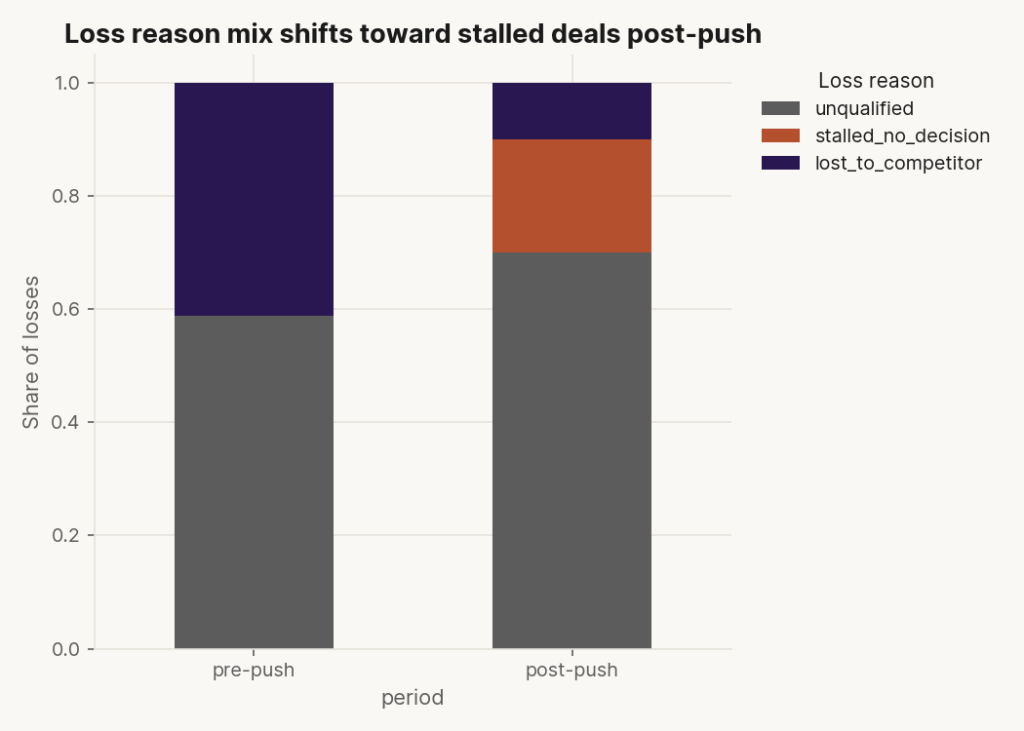
Execution, not competition, drove decline. Proposal stages doubled (34→57 days), negotiation stages more than doubled (36→78 days). Stalled deals went 0%→20.1%; lost-to-competitor fell 41.2%→9.9%. The problem is internal process, not external market. Execution problems masquerade as market problems.
Rep capability explains 60% of the decline. Experienced reps closed at 23.7%, inexperienced at 8.3%. That 15-point gap (95% CI [1.5, 29.3]pp) explains most of the 25-point drop. Team composition is a business lever.
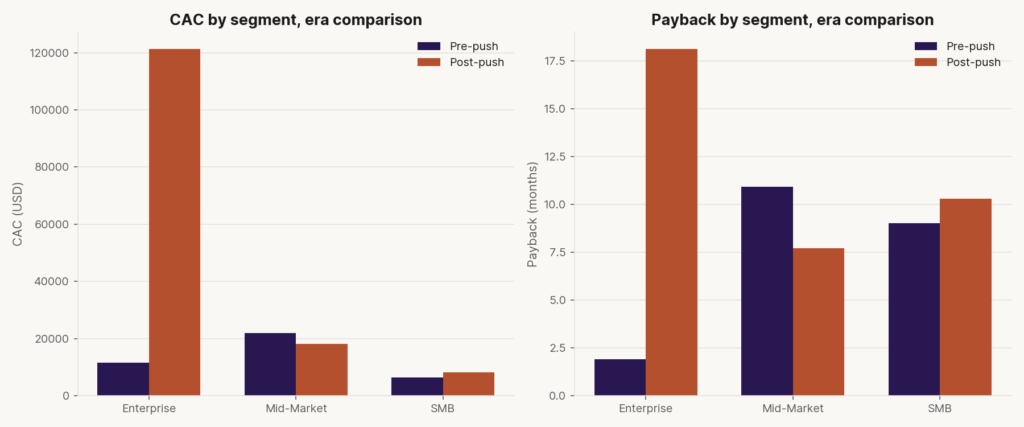
Cash impact: Enterprise payback stretched 2 months → 18 months. Enterprise represents 51.6% of S&M spend but only 10.7% of wins. A 25-point win-rate swing is not interesting data: it is runway just got shorter. Metrics only matter if they connect to cash.
Design decisions
- LTV method. Three-year cap gives 2.12:1 LTV:CAC (below 3:1 health threshold); naive 1/churn gives 8.82:1 (misleading). Method choice changes the signal.
- Competing explanations tested. Competitor, price, channel, and economic timing were each modeled. Three cleared; one showed modest effect. Ruling out alternatives is part of the finding.
What this demonstrates
Diagnosing hidden problems requires disaggregation before aggregates hide them. It means testing alternatives, not naming the first plausible explanation. It means choosing defensible methods over easy stories.
The five lessons generalize beyond B2B sales: aggregates hide the truth, measurement timing changes what you see, execution problems masquerade as market problems, team composition is leverage, and metrics disconnect from cash at your peril.
Full architecture and analysis in the GitHub case study.